What to watch
Four things cause most small-server outages: a full disk, no free memory, a crashed service and an expired certificate. You do not need an elaborate stack to catch them. Look interactively with htop, check from outside with an uptime monitor, and add a scheduled script for disk space.
Look at live usage with htop
htop shows processes sorted by CPU or memory, and the load on each core. Press F6 to change the sort order, and q to quit. Compare the load average with your core count: a load persistently above the number of cores means the server is busy.
sudo apt install htopsudo dnf install epel-release
sudo dnf install htophtop
uptime
nprocRun Uptime Kuma
Uptime Kuma is a self-hosted monitor that checks websites, ports and certificates and notifies you through email, chat apps and more. Run it in Docker (see the Docker guide), bound to localhost, and reach it over an SSH tunnel or a reverse proxy. A monitor running on the same server cannot tell you that the server itself is down, so for important sites also run one elsewhere, such as a second small server.
mkdir -p ~/uptime-kuma && cd ~/uptime-kuma
cat > compose.yaml <<'EOF'
services:
  uptime-kuma:
    image: louislam/uptime-kuma:2
    ports:
      - "127.0.0.1:3001:3001"
    volumes:
      - ./data:/app/data
    restart: unless-stopped
EOF
sudo docker compose up -dssh -L 3001:127.0.0.1:3001 deploy@YOUR_SERVERAdd useful monitors
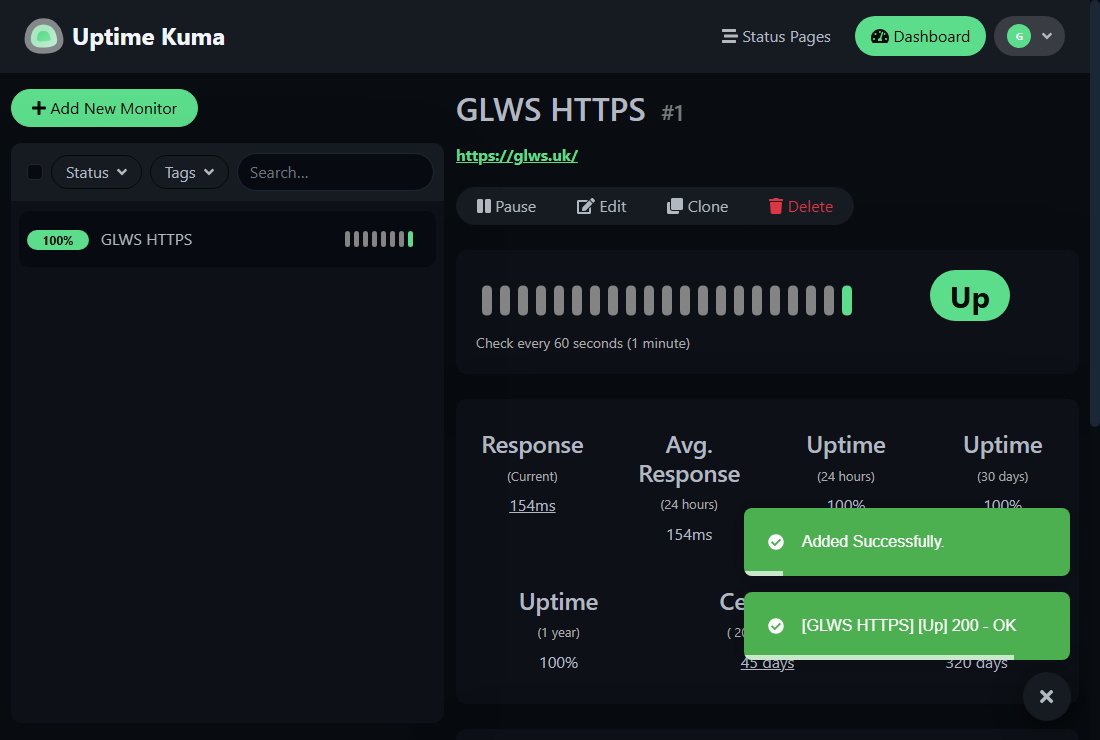
Add an HTTPS monitor for each public site with a check interval of one or two minutes, a TCP monitor for SSH on your server's port, and enable certificate expiry notifications on HTTPS monitors so you hear about an expired certificate before your visitors do. Add at least one notification channel and send a test message.
Alert on low disk space
A short script checks the root filesystem and posts a message when usage passes a threshold. This version sends to a webhook URL you control, such as your chat service's incoming webhook or an Uptime Kuma push monitor. Replace the URL. Test it by temporarily setting the threshold low.
sudo tee /usr/local/bin/disk-alert >/dev/null <<'EOF'
#!/bin/bash
THRESHOLD=85
USAGE=$(df --output=pcent / | tail -n 1 | tr -dc '0-9')
if [ "$USAGE" -ge "$THRESHOLD" ]; then
  curl -fsS -m 10 -X POST -H "Content-Type: application/json" \
    -d "{\"text\":\"$(hostname): root disk is ${USAGE}% full\"}" \
    https://YOUR-WEBHOOK-URL || logger -t disk-alert "webhook failed"
fi
EOF
sudo chmod 755 /usr/local/bin/disk-alert
sudo /usr/local/bin/disk-alertecho '0 * * * * root /usr/local/bin/disk-alert' | sudo tee /etc/cron.d/disk-alertFind what is using the space
When the alert fires, find the biggest directories, then check Docker and the journal, which are common causes. Clean up carefully. Never delete files you do not recognise.
sudo du -xh / --max-depth=2 2>/dev/null | sort -h | tail -n 15
sudo journalctl --disk-usage
sudo docker system df 2>/dev/null
Check services and certificates
List failed services and check certificate expiry from the command line. These commands are quick checks you can run any time or add to the alert script.
systemctl --failed
echo | openssl s_client -connect example.com:443 -servername example.com 2>/dev/null | openssl x509 -noout -enddate
Official documentation
These upstream references provide more detail on the commands and workflows in this guide.